Software · Organisation analytics
Atlas
A local-first, consulting-grade organisation design workspace. Import Excel or CSV org data, map reporting lines, diagnose spans and layers, model what-if scenarios, benchmark compensation, and export board-ready outputs.
Organisation design should not start from guesswork. Atlas turns raw Excel or CSV organisation data into a working analytical model — from field mapping and data-quality warnings through to org navigation, spans and layers, scenarios, AI-assisted recommendations, benchmarking, exports and governance support.
The workspace
The chart, the analytics, scenario modelling, data-quality review, recommendations, benchmarking and exports are one connected workspace, so a team moves from raw files to decisions with less manual work.
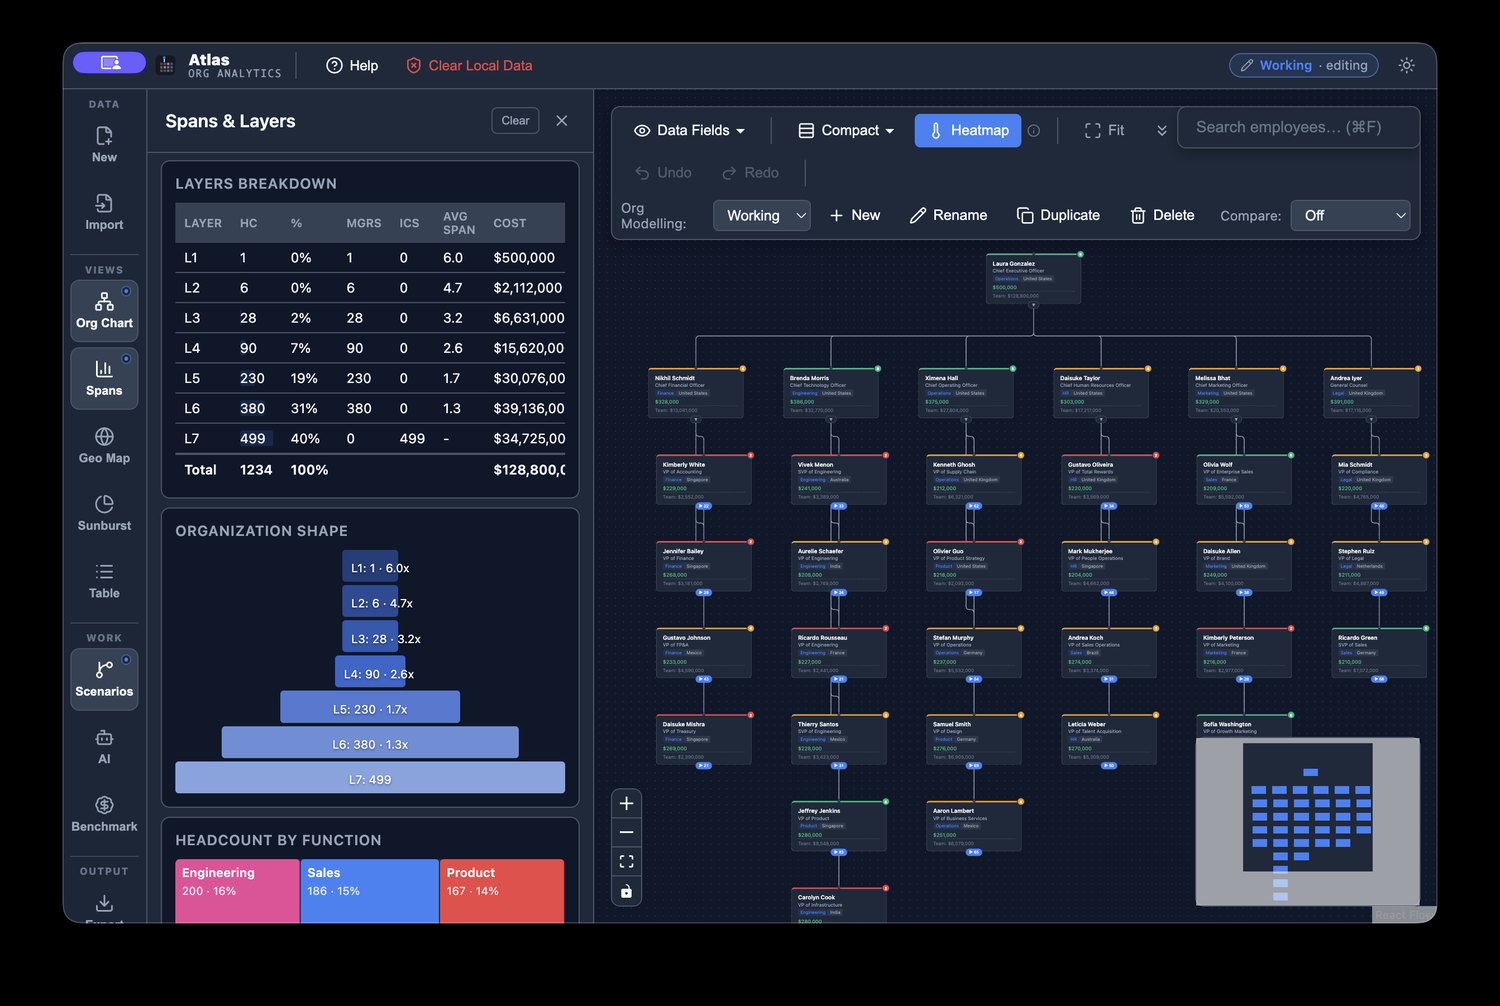
Import the org, choose a layout, inspect spans and work from a live chart.
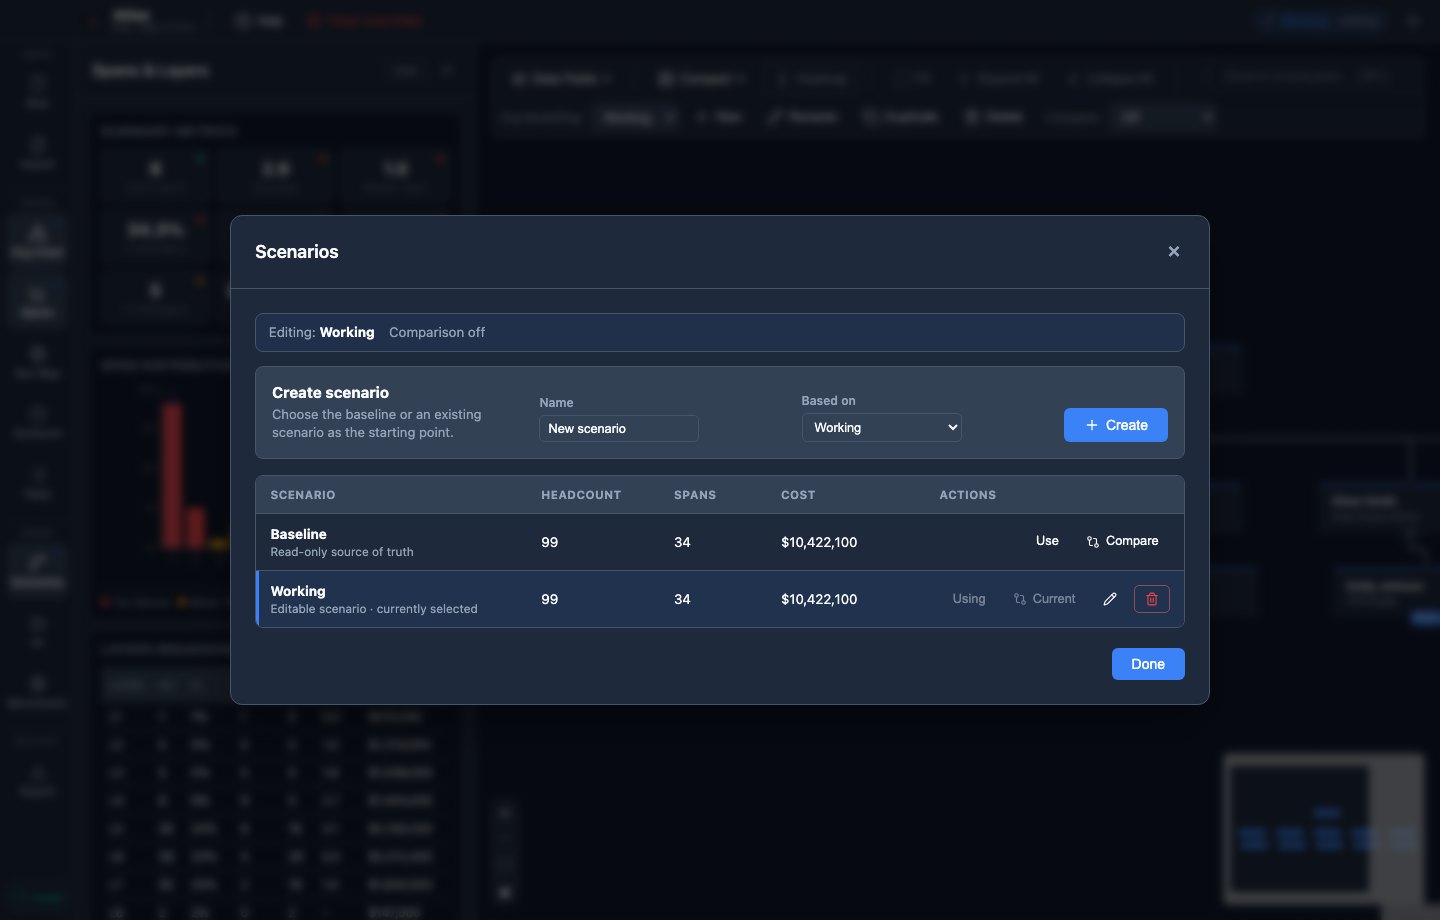
Branch from Baseline or Working, rename and manage alternatives.
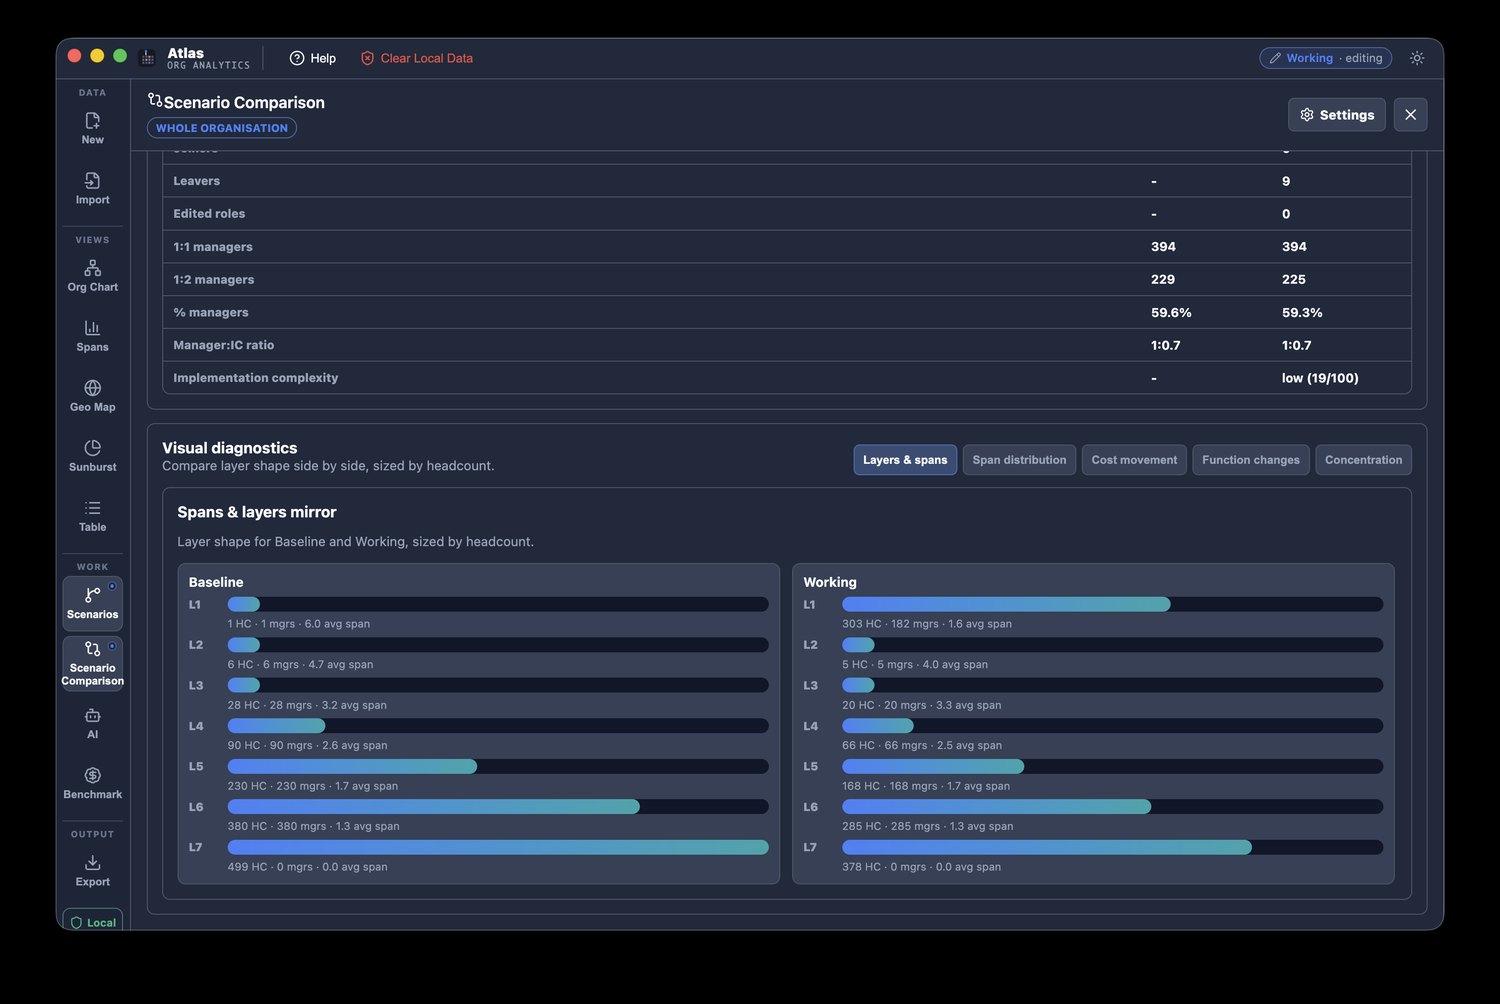
Movers, joiners, leavers, cost, spans, layers and manager load between any two scenarios.
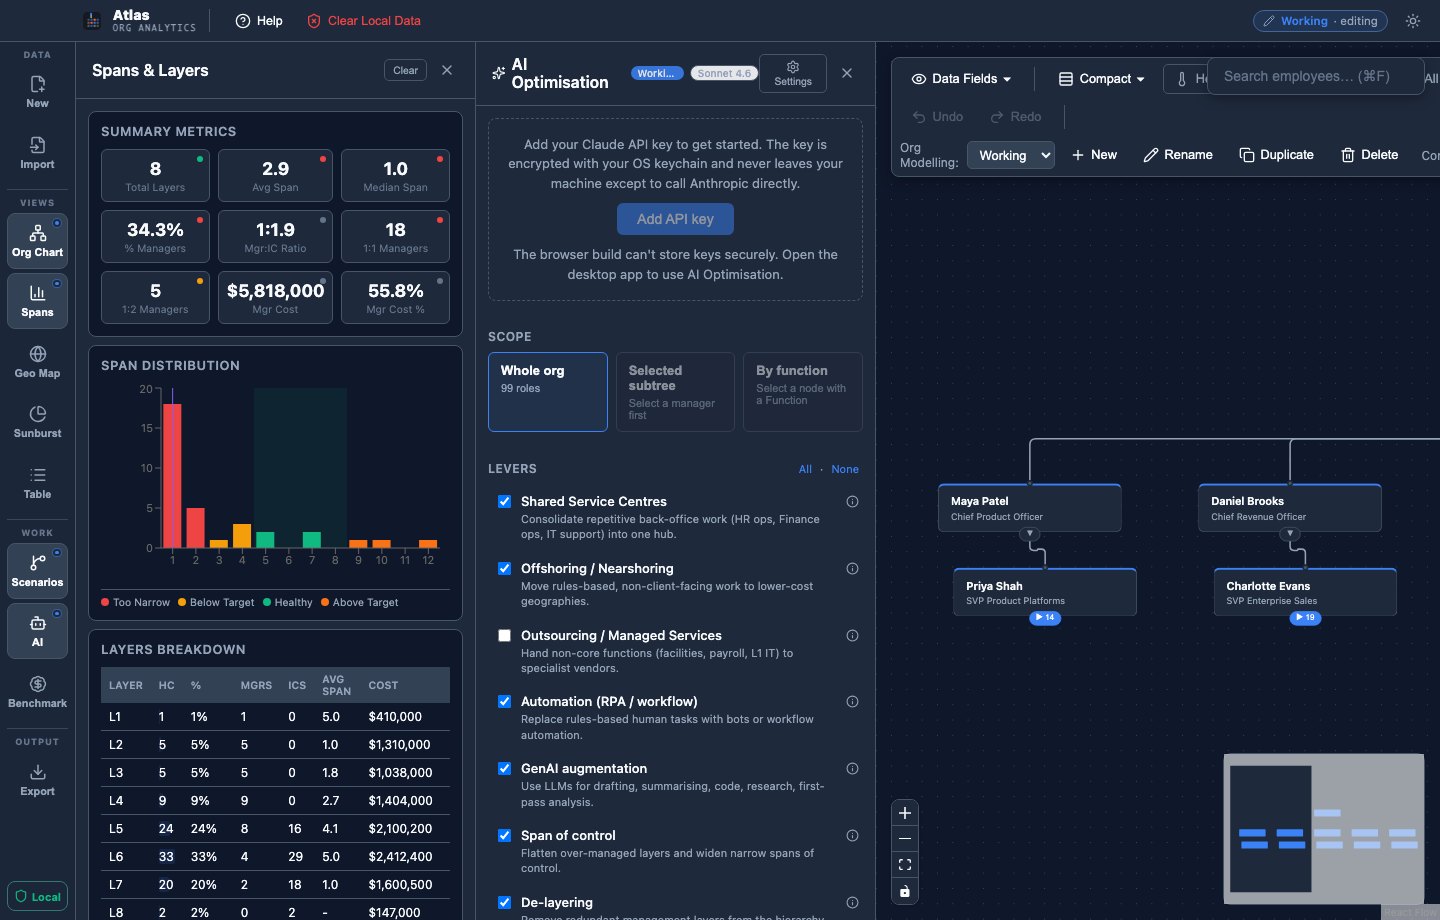
Organisation-design hypotheses across spans, de-layering, shared services and consolidation.
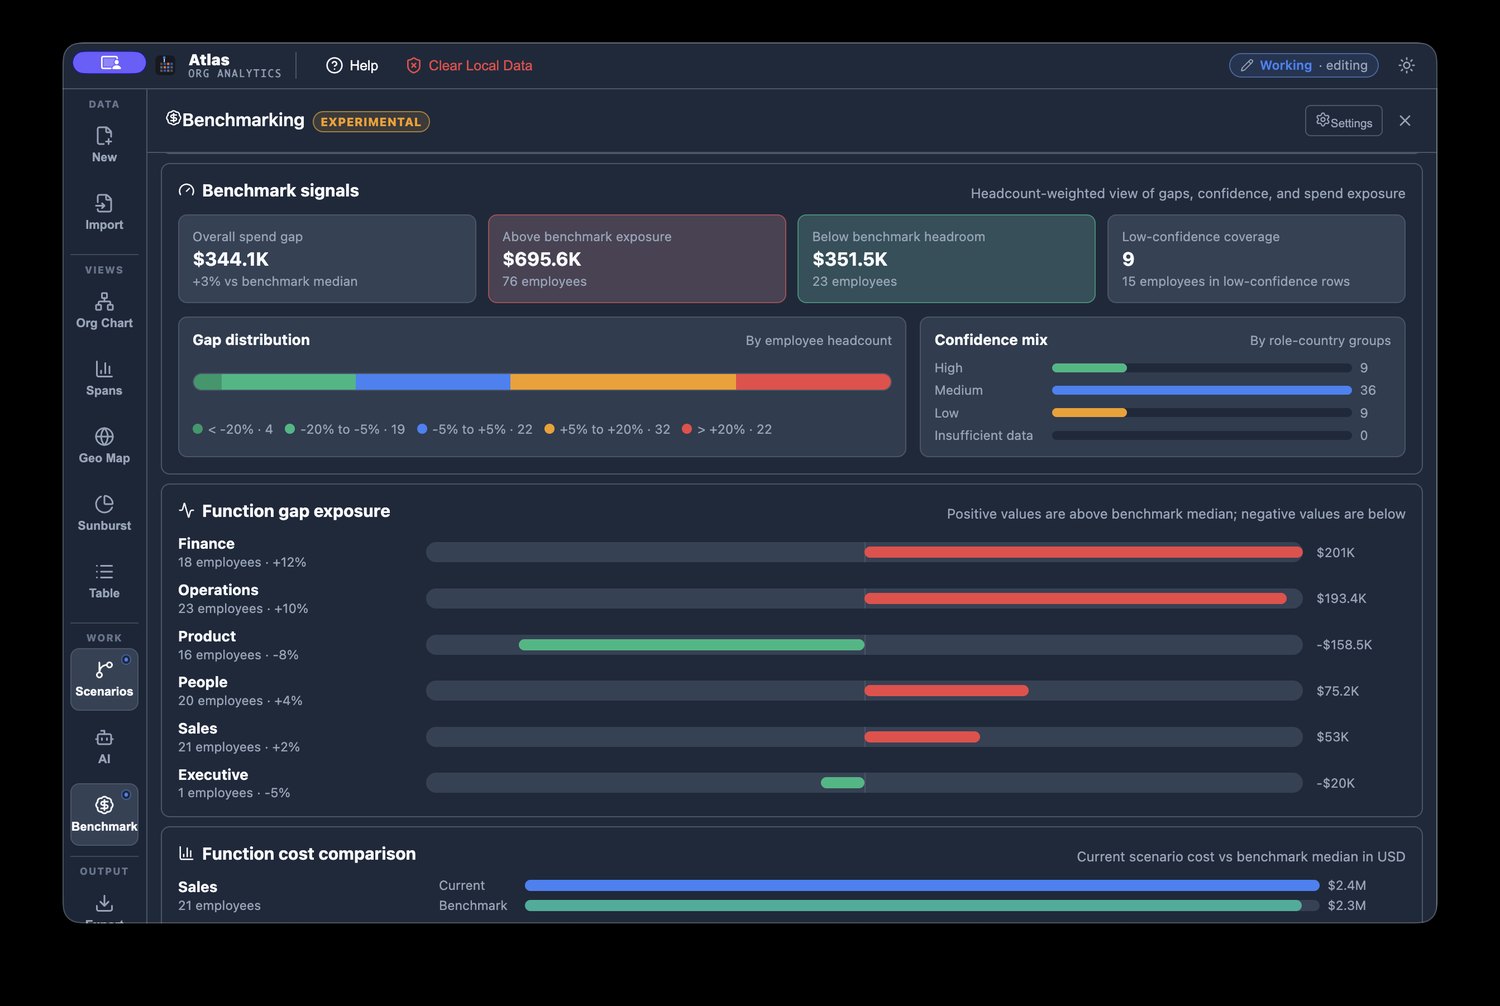
Indicative market salary signals, with the caveats kept visible.
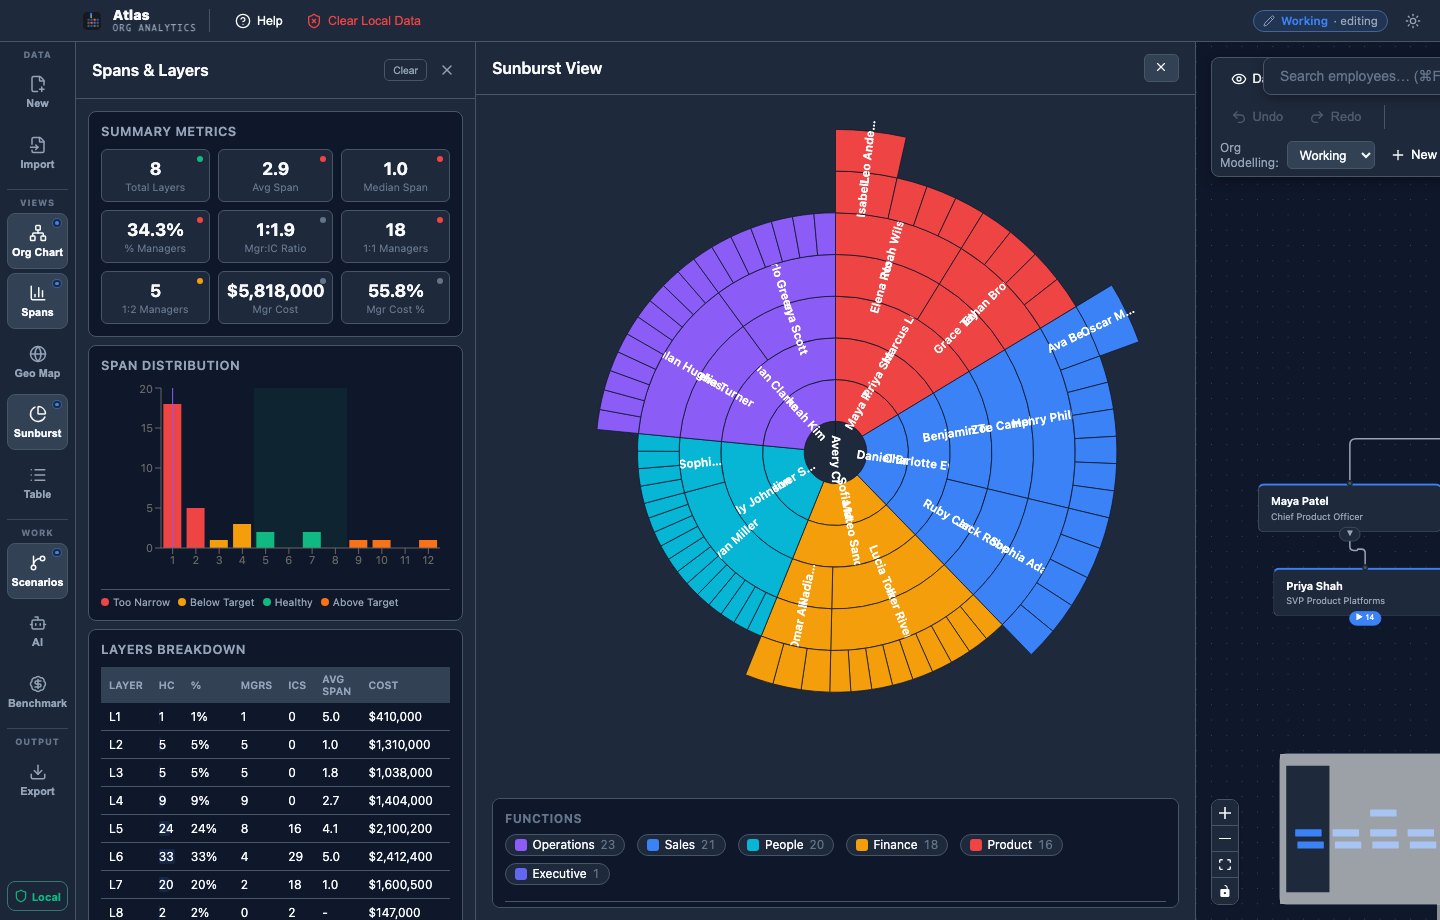
Hierarchy by headcount and cost, from the top down.
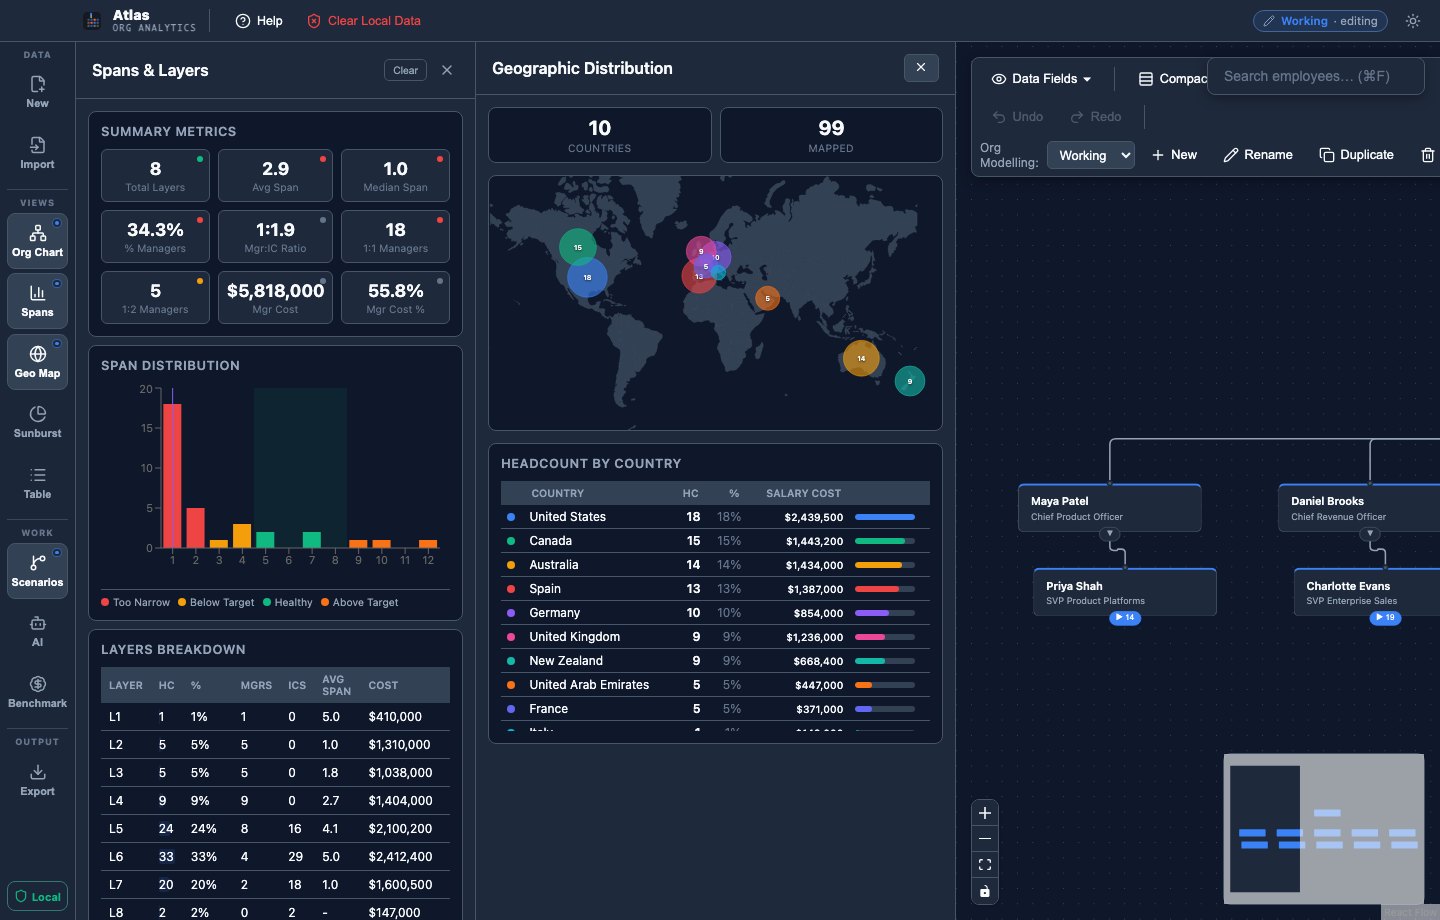
Where work, cost and decision rights actually sit.
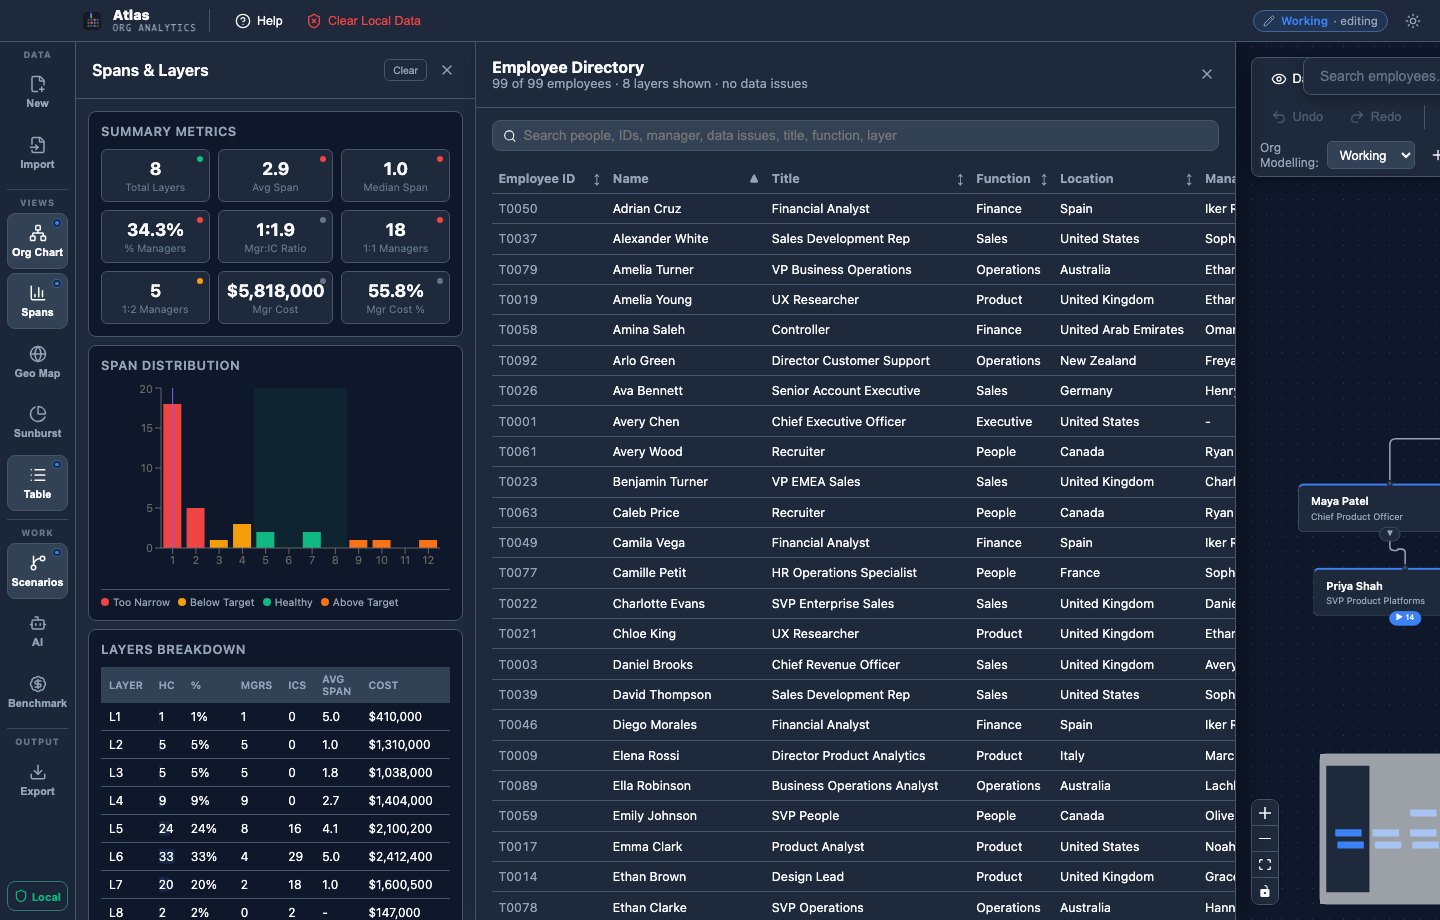
Every record, searchable, with data-quality flags attached.
Why it exists
Unlike generic org chart tools, Atlas combines local-first data handling, scenario modelling, AI-assisted critique, compensation benchmarking and presentation-ready outputs in one desktop workflow. It is built around the way transformation, HR, finance and advisory teams actually work: traceable analysis rather than a static chart.
- Fast to adopt. Start from Excel or CSV without a heavy implementation cycle.
- Desktop and local-first. Sensitive org and compensation data stays close to the machine it is worked on.
- Built for advisers. Designed around scenario modelling, analysis and leadership-ready narratives.
- Human-governed. Disclaimers, redaction, caveats and scenario review keep decisions accountable.
Organisation intelligence
- Spans and layers. Diagnose narrow spans, overloaded managers, excessive layers, manager cost and layer shape.
- Data quality flags. Spot duplicates, unresolved managers, broken reporting edges and suspicious imported relationships.
- Executive exports. Data, Excel analysis, PowerPoint decks, benchmark workbooks and benchmark summaries.
- Names removed before AI critique, enabled by default.
Built for sensitive data
Organisation and compensation data is among the most sensitive material in a business. Atlas keeps project files, analysis and exports inside a desktop boundary, applies redaction before anything reaches an AI model, and marks every AI output as a hypothesis for human review.